Custos Aeris: New evaluations for the preventive protection of historical art/lead glass (Part 1)
Overview and background of the new evaluations
In conventional measuring systems, data on thermodynamic measured variables such as air temperature, air humidity, glass temperature and dew point temperature are often obtained and displayed. The interpretation of the data series and diagrams is then up to the observer, who must judge for himself the effect of the thermodynamic variables on possible damage mechanisms in the case of the historically valuable art/lead glazing.
This is where the new evaluations by Custos Aeris take a different approach. On the basis of an intensive literature research on damage mechanisms and their effects on the paint layers, it was possible to establish relationships between the measured thermodynamic parameters and the resulting potential damage. Wherever possible, limit values were worked out from the literature and incorporated into the diagrams. This has resulted in a whole set of diagrams, the content of which addresses the following topics:
- Risk analysis with scatter diagrams
- Diagrams for identifying potential damage patterns
- Analysis of condensate formation
- Temperature and humidity alternating stress
- Original measurement data
With these diagrams an early detection of potential damage is possible. By initiating countermeasures, they therefore contribute to the preventive protection of historical art/lead glass. The diagrams shown are taken from an uninterrupted series of measurements taken in a cathedral from 30.09.2018 to 18.05.2020.
Part 1: Risk analysis with scatter diagrams
The aim of scatter diagrams is to quickly detect potential damage to historical art/lead glass on the air gap side and on the inside of the church.
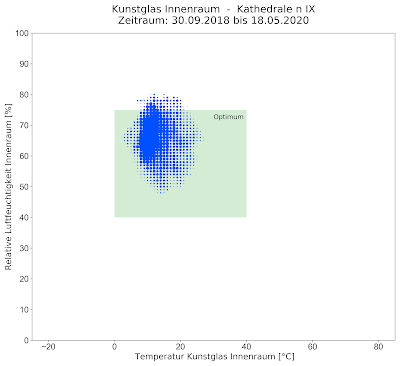
The relative humidity measured refers to the air in the air gap and the air in the immediate vicinity of the glazing inside the church. The ordinate shows the respective relative humidity and the abscissa represents the surface temperature of the art/lead glass. Inside is a green area that indicates the optimal conditions. All measuring points of the church should be in the green area. These values go back to /Hör 2016/ among others.
The next 2 diagrams show the quick overview for the art/lead glass on both sides. The following diagram shows the conditions for the protective glazing for the sake of completeness:
 |
| Scatter Diagram for the art/lead glass on the air-gap side |
 |
| Scatter Diagram for the art/lead glass on the in-church side |
and for completeness:
 |
| Scatter Diagram for the protective glazing on the air-gap side |
It is immediately apparent that the art/lead glazing is exposed to high risks on the air gap side. Inside the church it looks much better. The cloud is somewhat more inflated in the case of protective glazing because the outside climate has a stronger influence through the glazing here.
In part 2, the damage patterns are then discussed in more detail.
References:
/Hör 2016/ Hör, Martha and Fritsch, Alexandra et.a., Possibilities of climate stabilization for stained glass collections damaged by anthropogenic environmental influences, using the example of St. Sebald in Nuremberg, 2016
Direct contact:
michael.robrecht@ixtronics.com or hans.daams@hajuveda.solutions


Kommentare
Kommentar veröffentlichen