Posts

Es werden Posts vom Juli, 2020 angezeigt.

Custos Aeris: New evaluations for the preventive protection of historical lead glazing (Part 3)

Bild
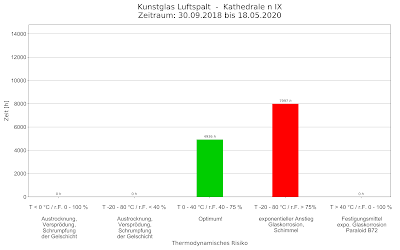
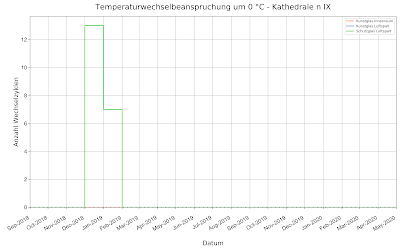
Risk Temperature and humidity alternating stress Risk of thermal cycling Thermal cycling around 0 degrees Celsius leads to the formation of ice and condensation. Solid and liquid phases change constantly. This leads to mechanical damage to the gel layer and cracks, crusts, cracking and detachment /Hör 06/. There are still no limits as to how often this may happen per defined time unit except "as little as possible". The following diagram shows the number of changes per time unit for protective glazing in a cathedral: Number of Thermal Cycles around 0 degrees C Risk of moisture cycling Moisture cycling around 80% leads to salt crystallization, cracking of the gel layer and intensification of corrosion /Hör 06/. Here too, there are no limit values, so that again the number of changes per unit of time is shown: Number of moisture Cycles around 80% relative humidity References: Garrecht, H., Hahn, O. & Kappes, K. e., 2010. model test for gap temperature control at the Divi Bl

Custos Aeris: New evaluations for the preventive protection of historical art/lead glass (Part 2)

Bild
Part 2: Traceability to damage patterns Below 0 degrees Celsius the glasses are in the frost zone. In artificial glazing this leads to drying out, embrittlement and shrinkage of the gel layer /Hör 06/.  Above 40 degrees Celsius the gel layer dries out, damages the solidifying agents and damages Paraloid B72. In addition, glass corrosion is exponentially promoted at high relative humidity with a doubling of the rate per 10 degrees temperature increase /Hör 06/.  Below 40% relative humidity, the gel layer is damaged by drying out, embrittlement and shrinkage /Hör 06/.  Above 60% relative humidity a sufficient moisture film for corrosion is already potentially present /Hör 2016/. Above 75% relative humidity an exponential increase in glass corrosion takes place /Garrecht 2010 and DBU project Mühlhausen/. In addition, the risk of mould formation increases /Schumacher 2010/. The following diagrams show over how many hours the system was in the optimal range and how many hours per measuremen

Custos Aeris: New evaluations for the preventive protection of historical art/lead glass (Part 1)

Bild
Overview and background of the new evaluations In conventional measuring systems, data on thermodynamic measured variables such as air temperature, air humidity, glass temperature and dew point temperature are often obtained and displayed. The interpretation of the data series and diagrams is then up to the observer, who must judge for himself the effect of the thermodynamic variables on possible damage mechanisms in the case of the historically valuable art/lead glazing. This is where the new evaluations by Custos Aeris take a different approach. On the basis of an intensive literature research on damage mechanisms and their effects on the paint layers, it was possible to establish relationships between the measured thermodynamic parameters and the resulting potential damage. Wherever possible, limit values were worked out from the literature and incorporated into the diagrams. This has resulted in a whole set of diagrams, the content of which addresses the following topics: Risk anal

Custos Aeris: Neue Auswertungen zum vorbeugenden Schutz der historischen Bleiverglasung (Teil 3)

Bild
Risiko Temperatur- und Feuchte-Wechselbeanspruchung Risiko Temperaturwechselbeanspruchung Temperaturwechselbeanspruchung um die 0 Grad Celsius herum führt zu Eis- und Tauwasserbildung. Feste und flüssige Phase wechseln ständig. Dies führt zu mechanischen Schäden an der Gelschicht und es bilden sich Risse, Krusten, Krakelierung und Ablösungen /Hör 06/. Es gibt noch keine Grenzwerte darüber, wie oft dies pro definierte Zeiteinheit passieren darf außer „möglichst wenig“. Im folgenden Diagramm wird die Zahl der Wechsel pro Zeiteinheit bei einer Schutzverglasung in einer Kathedrale dargestellt: Risiko Feuchtewechselbeanspruchung Feuchtewechselbeanspruchungen um die 80% herum führen zur Salzkristallisation, Reißen der Gelschicht und Verstärkung der Korrosion /Hör 06/. Auch hier gibt es keine Grenzwerte, so daß wiederum die Zahl der Wechsel pro Zeiteinheit dargestellt wird.                                          Referenzen:       Hör, M. u. F. A. e., 2016. Möglichkeiten einer Klimastabili